
News-Feeds:
Profiling TYPO3 with XHProf
There occur situations when your TYPO3 is awful slow and you have to figure out, why this is the case. Using a PHP profiler is the heavy hammer to gain the insights you need in this case.

Xdebug brings a PHP debugger and profiler. While I personally love the debugger together with PHP storm, the profiler output also needs a dedicated tool to browse through its results, e.g. KCachegrind or, again, PhpStorm.
So for profiling I learned to love XHProf, a PHP profiler developed by Facebook. Its advantage is that it has a PHP interface to show the results, which is nice to use and easily to integrate into TYPO3, as you will see in this article.
Installing the PHP Extension
Like Xdebug, XHProf also requires loading an own PHP extension. If your hoster doesn't allow it, do it locally. Otherwise you're able to profile even live sites, e.g. one of a million hits, based on a GET parameter, or whatever you want. That's the nice thing that you can control this through PHP.
There is a PECL package xhprof, which you have to install, in order to build the PHP extension. On your development Mac you can also install php5-xhprof, in case you are using MacPorts. If installation through PECL, please refer to this blog post, from which I took my setup.
pecl config-set preferred_state beta
pecl install xhprof
To load the extension, add these lines to your php.ini
[xhprof]
extension=xhprof.so
xhprof.output_dir="/var/tmp/xhprof"
The data collected during a profiler run will be saved to this output_dir.
Restart your web server and check with phpinfo() that XHProf is listed!
XHProf Results Interface
Now download the XHProf PHP files from the PECL site and extract them to wherever you want in the site's document root or accessible through a separate virtual host.
We will assume that they reside in /var/www/xhprof.example.com/ and are reachable under http://xhprof.example.com. Opening http://xhprof.example.com/xhprof_html/ should then give you a "No XHProf runs specified in the URL." message.
This vhost needs read access to the previously configured output_dir, I guess. So be careful with open_basedir restrictions.
Activating the Profiler
In order to really run the profiler, you have to include this code, which starts debugging:
include_once '/var/www/xhprof.example.com/xhprof_lib/utils/xhprof_lib.php';
include_once '/var/www/xhprof.example.com/xhprof_lib/utils/xhprof_runs.php';
xhprof_enable(XHPROF_FLAGS_CPU + XHPROF_FLAGS_MEMORY);
As this is not sufficient, you also have to include some code to really safe the collected data:
$profiler_namespace = 'typo3';  // namespace for your application
$xhprof_data = xhprof_disable();
$xhprof_runs = new XHProfRuns_Default();
$run_id = $xhprof_runs->save_run($xhprof_data, $profiler_namespace);
To make inclusion easier, we create two files for later inclusion:
/usr/share/php5/utilities/xhprof/header.php
<?php
if (extension_loaded('xhprof')) {
    include_once '/var/www/xhprof.example.com/xhprof_lib/utils/xhprof_lib.php';
    include_once '/var/www/xhprof.example.com/xhprof_lib/utils/xhprof_runs.php';
    xhprof_enable(XHPROF_FLAGS_CPU + XHPROF_FLAGS_MEMORY);
}
?>
/usr/share/php5/utilities/xhprof/footer.php
<?php
if (extension_loaded('xhprof')) {
$profiler_namespace = 'typo3'; // namespace for your application
$output_url = "http://xhprof.example.com/" // keep the trailing slash
$xhprof_data = xhprof_disable();
$xhprof_runs = new XHProfRuns_Default();
$run_id = $xhprof_runs->save_run($xhprof_data, $profiler_namespace);
// url to the XHProf UI libraries (change the host name and path)
$profiler_url = sprintf($output_url . 'xhprof_html/index.php?run=%s&source=%s', $run_id, $profiler_namespace);
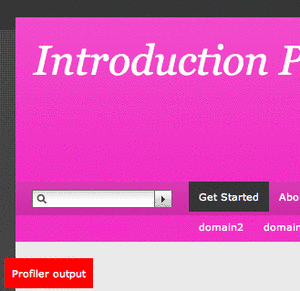
$styles = ' style="display: block; position: absolute; left: 5px; bottom: 5px; background: red; padding: 8px; z-index: 10000; color: #fff;"';
echo '<a href="'. $profiler_url .'" target="_blank" ' . $styles . '>Profiler output</a>';
}
?>
Now go and modify the index.php of your TYPO3 installation to look like this:
<?php
/usr/share/php5/utilities/xhprof/header.php
require('typo3_src/index.php');
/usr/share/php5/utilities/xhprof/footer.php
?>
You will hopefully end up with a shiny red box on the bottom left. Use the link there to browse through the collected results. If something fails, double-check the entered paths and URLs.
Further Tuning
- Instead of modifying the index.php, you could also set PHP's auto_(prepend|append)_file options to header.php and footer.php. This might be useful for other applications than TYPO3 or if you e.g. want to profile the backend with its one million entry points (alt_doc.php etc).
- To selectively run the profiler, modify the header and footer file and add your own conditions.
- If you have installed GraphViz on your server, you can get nice call graphs, like this one.
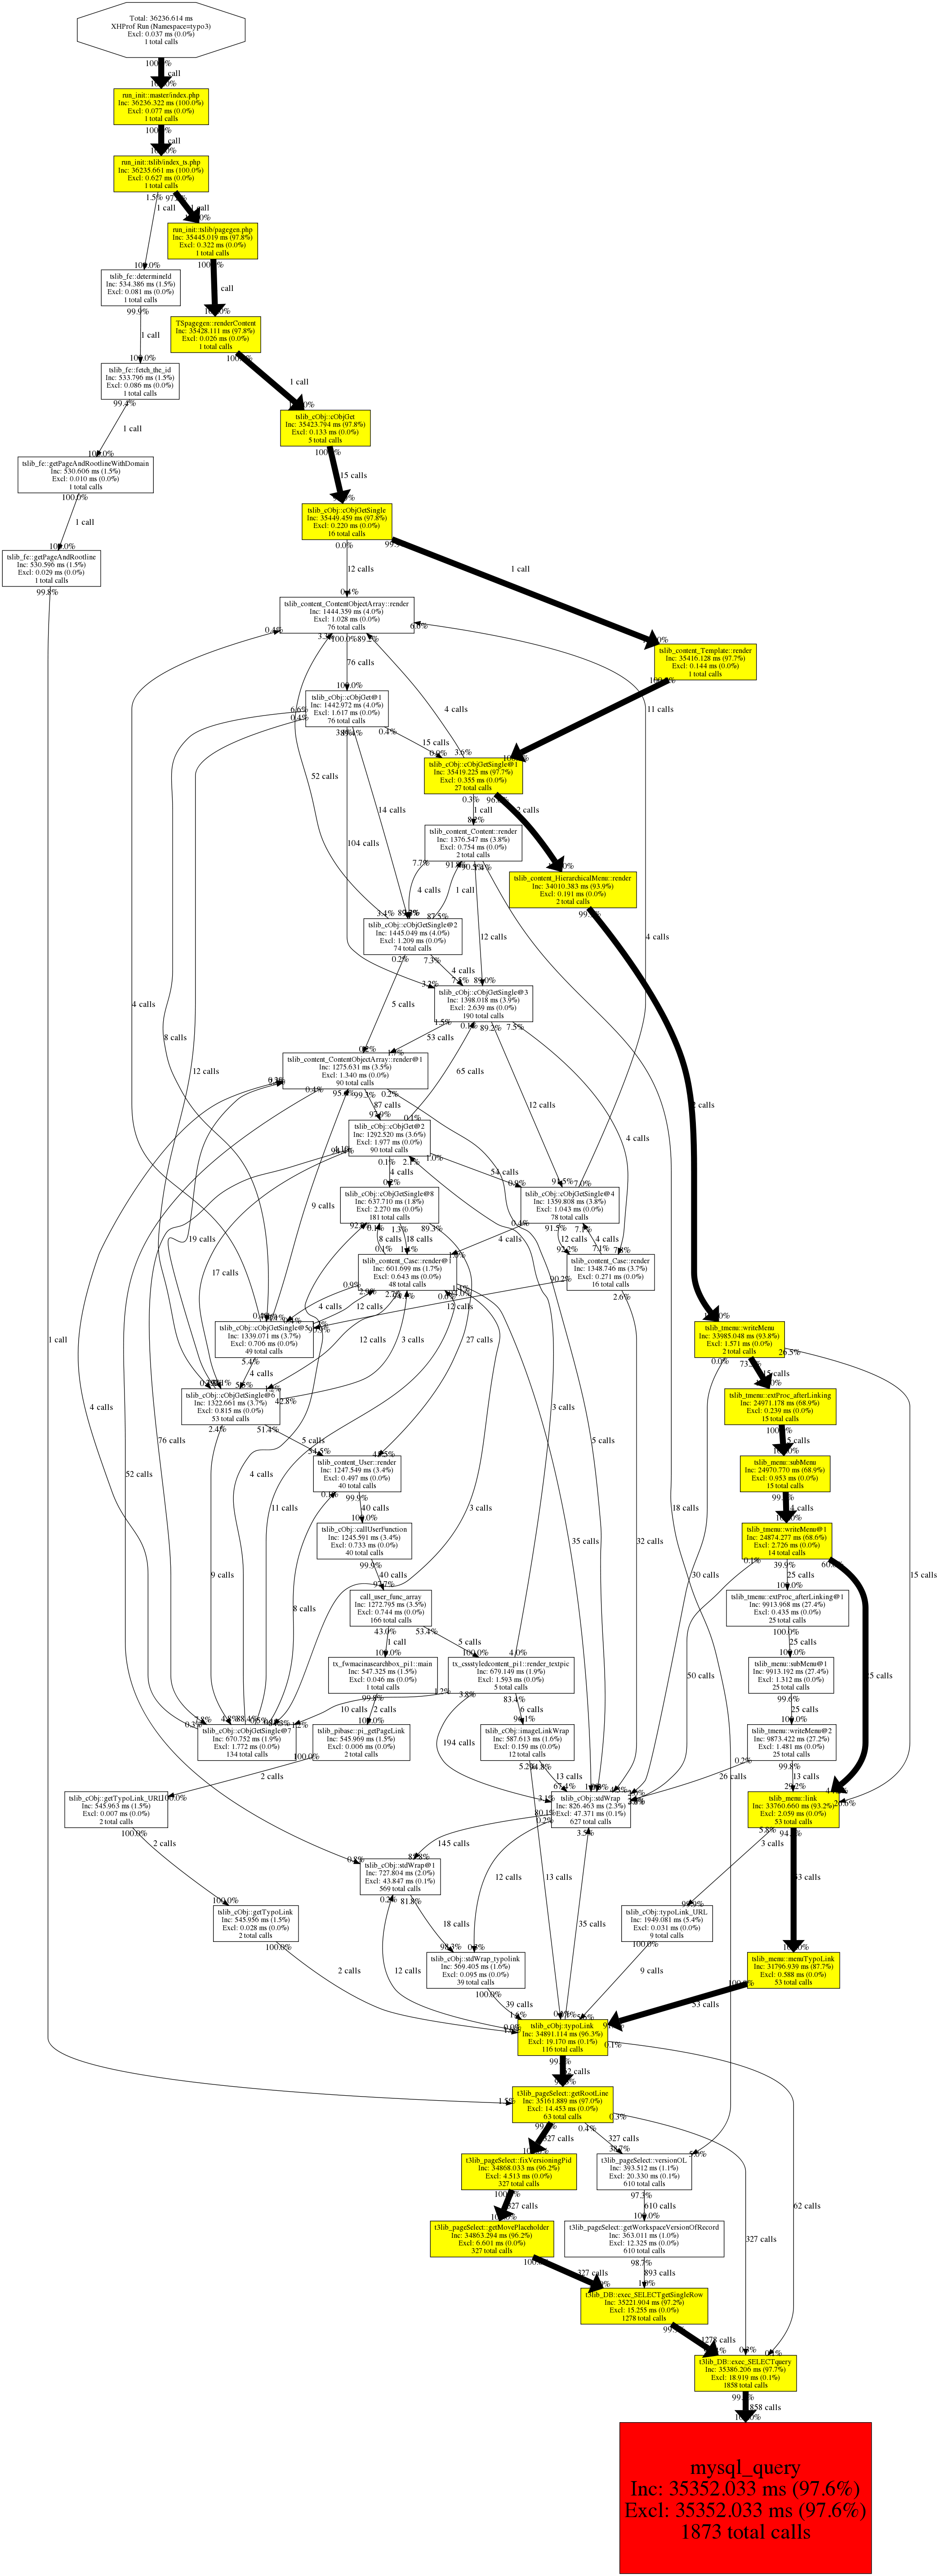
More detailed information - also how to read the output - can be found in the original blog post by Lorenzo Alberton, where I got the idea and setup from: http://techportal.ibuildings.com/2009/12/01/profiling-with-xhprof/. He earns most credits for my post. Please read that article, there's a lot more to learn!
If further problems occur, please ask through the typo3.dev mailing list.
EDIT Jan 2013: In the meantime, two additional GUIs are known to me:
- Plumber by Sebastian Kurfürst is a TYPO3 Flow package (YouTube video from T3CON12).
- I've been asked by Gajus Kuizinas to refer to his alternative GUI: http://xhprof.io. I haven't tested it, yet, but it also looks very nice and useful.
I'm happy to receive feedback what you like more!
comments
I don't know, if there's a hook at that point, before plugin rendering is started (neither pibase, nor extbase). If sb. tells me that information, I would add it, of course.
At this place, the two files (header/footer) could be included.
But I guess it's not so hard to find the own plugin - just search for a class or function name and navigate through its parent's hierarchy to the point, wher the plugin is initialized.
I decided to compile unofficial Windows vc9 version that I couldn't find on the Internet before. It can be found here http://dev.freshsite.pl/php-extensions/xhprof.html.
cheers!
@Ernesto, Steffen:
If looking for a hook to profile plugins only, you could 'wrap' around USER and USER_INT with an existing hook. Take a look at enetcacheanalytics (forge), it makes use of it to track plugin run times.
Thanks for your comment, Ernesto.
I don't know, if there's a hook at that point, before plugin rendering is started (neither pibase, nor extbase). If sb. tells me that information, I would add it, of course.
At this place, the two files (header/footer) could be included.
But I guess it's not so hard to find the own plugin - just search for a class or function name and navigate through its parent's hierarchy to the point, where the plugin is initialized.
Buzz is the official blog resource of the TYPO3 project. You can be part of Buzz too. If you want to blog about the achievements of your team or your personal involvement please check out our HELP section.
Maybe you could add some additional info for those who just want to debug "their own plugin" and not the whole TYPO3 rendering? Might be useful for example for checking out *what* takes so long in an Extbase extension.
Thanks!!